Understanding Support and Resistance Levels in Indian Markets
If you've ever wondered why stock prices seem to bounce back from certain levels or struggle to break past specific price points, you're not alone. Support and resistance levels are among the most fundamental concepts in technical analysis, and understanding them can dramatically improve your trading and investing decisions in the Indian stock market. These invisible price barriers act as floors and ceilings, helping you identify optimal entry and exit points while managing risk more effectively.
What Are Support and Resistance Levels?
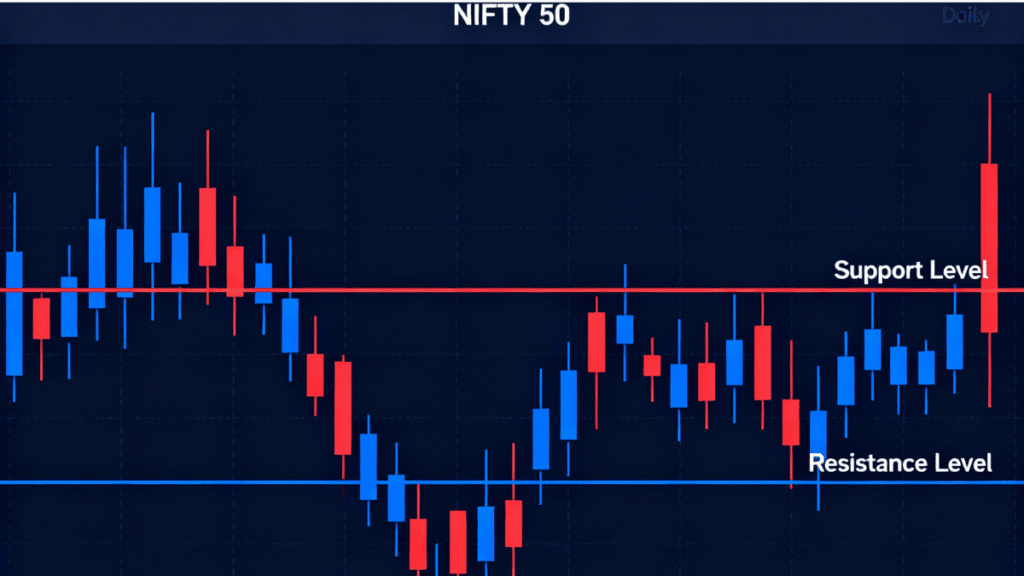
Support is a price level where buying interest is strong enough to prevent the stock from falling further. Think of it as a floor beneath the stock price. When prices approach this level, demand increases as buyers see value in the asset, creating upward pressure that stops or reverses the decline.
Resistance, on the other hand, is a price level where selling pressure emerges, preventing the price from rising further. It acts like a ceiling above the current market price. At this level, supply exceeds demand as sellers take profits or new short sellers enter the market, pushing prices back down.
For example, if Tata Motors consistently bounces back every time it falls to ₹400, that price point becomes a support level. Conversely, if the stock repeatedly fails to rise above ₹450, with sellers stepping in each time it approaches this level, ₹450 acts as resistance.
Why Support and Resistance Levels Matter for Investors
Understanding these levels is essential for several practical reasons that directly impact your trading success in Indian markets.
Clear Entry and Exit Points: These levels provide structure to your trading decisions. Instead of guessing when to buy or sell, you can make informed choices. Traders typically enter long positions when prices approach support and book profits near resistance levels.
Risk Management: Support and resistance help you place logical stop-loss orders. By setting stops just below support for long positions or just above resistance for short positions, you limit potential losses while giving your trades room to breathe. This disciplined approach prevents emotional decision-making during market volatility.
Psychological Importance: These levels carry significant psychological weight among market participants. Round numbers like ₹100, ₹500, or ₹1,000 often act as natural support or resistance zones because traders gravitate toward these easy-to-remember figures when setting targets and stop-losses. The Nifty 50 commonly respects round numbers like 23,000 or 22,500.
Trend Confirmation: Breakouts above resistance signal potential bullish trends, while breaks below support indicate bearish continuation. Volume confirmation during these breakouts adds credibility to the price movement.
Real-Life Example: Bank of India
Consider Bank of India trading at ₹146.52 with historical resistance around ₹147.80 and support near ₹90.05. If you observe the stock approaching the ₹146-147 zone with increasing volume, this resistance level becomes critical. A decisive break above ₹147.80 with strong volume could signal a bullish breakout, offering a buying opportunity. Conversely, if the price gets rejected at this level, it presents a potential short-selling setup with a stop-loss placed just above the resistance.
How to Identify Support and Resistance Levels
Identifying these levels correctly separates profitable traders from those who struggle. Here's a systematic approach used by successful traders in India.
Step 1: Use Swing Highs and Swing Lows
On daily or weekly charts, mark the swing highs (peaks) and swing lows (troughs). Swing highs tend to act as resistance, while swing lows become support. These turning points in price action represent areas where market sentiment shifted significantly.
Rather than drawing exact price lines, use zones that are 20-40 points wide. Markets rarely respect precise numbers, so zones account for minor price fluctuations and improve accuracy.
Step 2: Connect at Least Three Price Action Zones
For a support or resistance level to be valid, it should connect at least three price action zones that are well-spaced in time. The more times a level is tested, and the more distance between tests, the stronger and more reliable that level becomes.
If a stock bounced from ₹600 in January, again in March, and once more in June, the ₹600 level is a well-established support zone worth monitoring.
Step 3: Multi-Timeframe Confirmation
Analyze multiple timeframes to strengthen your analysis. A level that appears on daily, weekly, and monthly charts carries more weight than one visible only on a 15-minute chart. For day trading, check hourly and 15-minute charts. For swing trading, focus on daily and weekly timeframes.
Step 4: Apply Additional Tools
Historical Price Levels: Review past charts to identify price points where the asset consolidated or reversed direction.
Moving Averages: The 50-day and 200-day moving averages often act as dynamic support and resistance levels. When a stock's price approaches these averages, they can provide additional confirmation.
Fibonacci Retracement: Use Fibonacci levels (23.6%, 38.2%, 50%, 61.8%) to identify potential support and resistance zones. When a Fibonacci level aligns with a historical support or resistance area, the probability of a price reaction increases significantly.
Round Numbers: Pay special attention to psychological levels ending in zero. Stocks often pause or reverse at prices like ₹50, ₹100, ₹500, or ₹1,000 due to clustering of buy and sell orders at these levels.
Volume Profile: Examine where high trading volume occurred. Areas with heavy volume become stronger support or resistance because they represent significant market participation.
Step 5: Observe Role Reversal
One fascinating characteristic of support and resistance is their ability to switch roles. When a support level is broken, it often becomes a new resistance level. Similarly, when resistance is breached, it frequently transforms into support.
Imagine Nifty breaking above the 22,800 resistance level with strong volume and sustaining above it. On a subsequent pullback, 22,800 could now act as support. This role reversal happens because the market's perception of that price level has fundamentally changed.
Strategies to Apply Support and Resistance Levels
Now that you know how to identify these levels, let's explore practical strategies you can implement in your trading.
Range Trading Strategy
In markets that move sideways within a defined range, you can profit from predictable bounces. Here's the approach:
- Identify the support and resistance boundaries of the range
- Enter long positions when price approaches support with confirmation signals like bullish candlestick patterns (hammer, doji, bullish engulfing)
- Exit or short when price nears resistance with bearish signals
- Place stop-loss just below support for long trades and just above resistance for short trades
- Set profit targets near the opposite boundary of the range
Important: Range trading works best in sideways markets. Avoid this strategy during strong trending periods as levels are more likely to break.
Breakout Trading Strategy
When price breaks through support or resistance with conviction, it signals a potential trend change. Here's how to trade breakouts:
- Identify a well-established support or resistance level tested multiple times
- Wait for price to break decisively through the level
- Confirm with volume at least 150% of the 50-day average
- Enter the trade 1-2% beyond the breakout level to avoid false breakouts
- Place stop-loss just beyond the broken level (below for upside breakouts, above for downside breakouts)
- Set initial profit targets based on the previous range height
Example: Stock ABC consolidates between ₹100 and ₹110 for several weeks. When it breaks above ₹110 with high volume, enter a long position at ₹112, place a stop-loss at ₹108, and target ₹150 based on potential upward momentum.
Bounce Trading Strategy
This strategy capitalizes on price reversals at established levels:
- Wait for price to approach a known support (in uptrends) or resistance (in downtrends)
- Look for price action confirmation such as pin bars, hammer candles, or engulfing patterns
- Enter the trade with a tight stop-loss just beyond the level
- Target the opposite boundary or a predetermined profit level
The key is patience—wait for confirmation before entering rather than anticipating the bounce.
Pro Tips for Success
Use Volume as Confirmation: Support and resistance levels accompanied by high trading volume are more reliable. Volume validates the strength of these zones and increases the likelihood of price reactions.
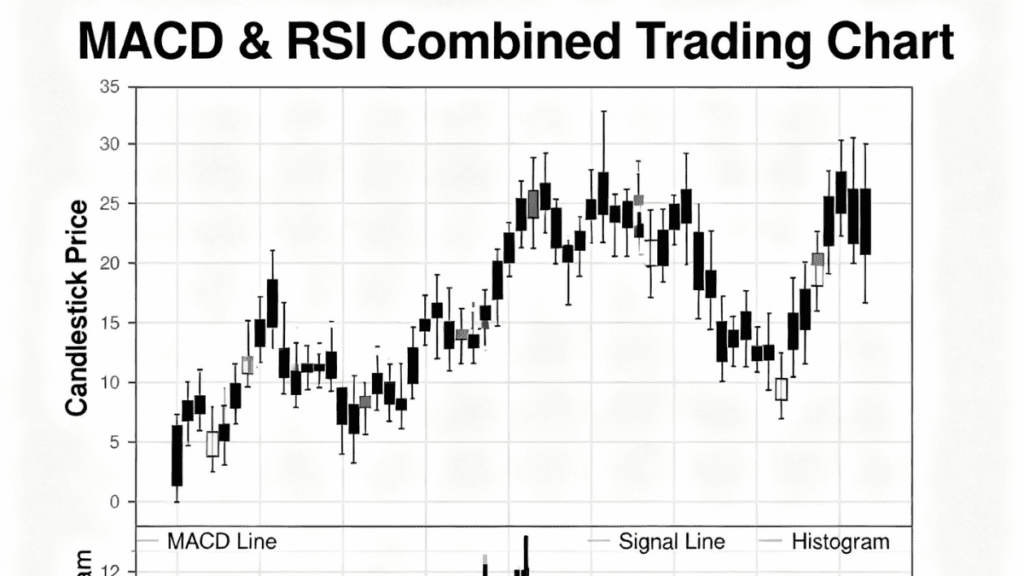
Combine with Indicators: Enhance your analysis by using RSI (Relative Strength Index) to identify overbought/oversold conditions at key levels, MACD for trend strength confirmation, and Bollinger Bands to gauge volatility.
Practice Multi-Timeframe Analysis: Always verify levels on higher timeframes before trading on lower ones. A support level on a 15-minute chart means little if the daily chart shows strong resistance at the same price.
Allow for Price Noise: Don't treat support and resistance as exact lines—view them as zones. Markets can briefly pierce through levels before reversing, so give your trades some breathing room.
Common Mistakes to Avoid
Even experienced traders make errors when applying support and resistance concepts. Here are the most critical mistakes and how to avoid them.
Drawing Random Lines: Many traders draw support and resistance lines arbitrarily without using proper swing highs and lows. Always base your levels on clear price action zones with multiple touches well-spaced in time.
Ignoring False Breakouts: Not all breakouts lead to sustained moves. Some are traps designed to catch inexperienced traders. Always wait for a candle to close beyond the level and confirm with increased volume before entering.
Treating Every Level the Same: Not all support and resistance levels are equal. Levels tested multiple times over longer periods on higher timeframes are stronger than those appearing briefly on intraday charts. Allocate your risk accordingly.
Setting Stop-Loss Too Close: Placing stops immediately at the support or resistance level often results in premature exits due to normal market noise. Leave some buffer space to account for minor fluctuations while still protecting your capital.
Ignoring Higher Timeframes: Focusing only on lower timeframes while overlooking key levels on daily or weekly charts leads to poor trading decisions. Always check the bigger picture before committing to a trade.
Over-Relying on Support and Resistance Alone: These tools work best when combined with other forms of analysis. Use them alongside trend indicators, volume analysis, and fundamental factors for a comprehensive view.
Buying Choppy Moves Into Support: When price approaches support in a choppy, indecisive manner with multiple lower highs, the level is likely weakening. Look for clean, single moves into support for the highest-probability setups.
Attempting to Predict Exact Reversals: Trying to pick exact turning points often leads to losses. Instead, wait for confirmation signals through price action or indicators before entering positions.
Disregarding Fundamental Events: Economic announcements, earnings reports, and policy changes can override technical levels. Always be aware of scheduled events that might impact your trades regardless of technical setups.
Expert Insights on Market Behavior
Research in behavioral finance reveals why support and resistance levels work so effectively. Traders exhibit cognitive biases and anchor their decisions to round numbers and previous price levels. This collective behavior creates self-fulfilling prophecies—because everyone watches the same levels, they become significant.
Studies show that 70-80% of major price moves align with institutional activity visible through volume data. When high volume occurs at a specific price level, it strengthens that zone as support or resistance because it represents significant market participation and commitment.
The psychological impact cannot be overstated. When prices approach round numbers like Nifty 23,000 or Bank Nifty 50,000, traders experience heightened emotions—greed near resistance as they consider taking profits, and fear near support as they worry about further declines. Understanding this psychology helps you anticipate market behavior and position yourself advantageously.
Related Topics You Can Explore
- Read also: Beginner’s Guide to Stock Trading: Tips, Steps & Common Mistakes
- Read also: Complete Guide to Bollinger Bands for Stock Trading in India
- Read also: How to Use MACD with RSI Indicator for Trading Signals
- Read also: Understanding Candlestick Patterns for Indian Stock Market
How to Start Trading with Support and Resistance Levels
Ready to apply these concepts? Here's a step-by-step approach for beginners:
Step 1: Open your charting software and select a stock you want to analyze. Start with well-known companies like Reliance Industries, HDFC Bank, or TCS that have good liquidity.
Step 2: Switch to the daily chart and identify at least three clear swing highs and three swing lows over the past 3-6 months. Mark these on your chart.
Step 3: Draw horizontal zones (not lines) connecting these swing points. Make each zone 20-40 points wide to account for market noise.
Step 4: Check the weekly chart to see if any of your identified zones align with levels on this higher timeframe. Those that do are your strongest levels.
Step 5: Wait patiently for price to approach one of these zones. Don't force trades—let the market come to your levels.
Step 6: When price nears your zone, look for confirmation through candlestick patterns, volume spikes, or indicator signals like RSI divergence.
Step 7: Enter your trade with a well-defined stop-loss just beyond the zone and a profit target based on the next significant level or a 2:1 risk-reward ratio.
Step 8: Practice this process repeatedly on a demo account or with small position sizes until you develop consistency and confidence.
FAQs About Support and Resistance Levels
Q1. What is the minimum capital needed to start trading support and resistance strategies?
A1. You can start with as little as ₹5,000 to ₹10,000, depending on your broker's margin requirements. However, proper risk management suggests risking no more than 1-2% of your capital per trade, so starting with ₹25,000 to ₹50,000 allows for better position sizing and risk control.
Q2. Are support and resistance levels reliable in volatile markets like Indian stocks?
A2. Support and resistance work in all market conditions, but their reliability depends on timeframe, volume, and the number of times a level has been tested. During high volatility, use wider zones and higher timeframes for better accuracy. Levels confirmed by high volume and multiple tests are most dependable even during volatile periods.
Q3. How long do support and resistance levels remain valid?
A3. Strong levels can remain relevant for months or even years, especially on weekly and monthly charts. The validity increases with the number of times the level has been tested and the significance of those tests. However, levels can become obsolete after a decisive breakout with high volume, at which point they may reverse roles.
Q4. Can beginners effectively use support and resistance without other technical tools?
A4. While support and resistance are foundational, beginners achieve better results by combining them with simple tools like volume analysis and moving averages. This combination provides confirmation and reduces false signals. As you gain experience, you can incorporate more sophisticated indicators, but the basic framework of support and resistance with volume confirmation is sufficient to start.
Conclusion
Support and resistance levels serve as the foundation of technical analysis in Indian stock markets, providing clear frameworks for identifying entry points, setting stop-losses, and managing risk effectively. By learning to recognize these critical price zones through swing highs and lows, confirming them with volume and multiple timeframes, and understanding the psychological factors that make them work, you equip yourself with powerful tools for making informed trading decisions.
Remember that mastery comes through practice and patience. Start by identifying levels on charts without trading, observe how prices react at these zones, and gradually build your confidence through paper trading before committing real capital. Combine support and resistance analysis with sound risk management, avoid common mistakes like chasing false breakouts or ignoring higher timeframes, and continuously refine your approach based on what the market teaches you.
The Indian markets respect these levels because millions of participants—from retail traders to institutional investors—watch the same price points and make decisions based on them. By understanding and applying these concepts systematically, you position yourself to trade alongside smart money rather than against it, increasing your probability of success in the dynamic world of stock market investing.