Complete Guide to Bollinger Bands for Stock Trading
If you've ever wondered how to identify the right entry and exit points in the stock market or predict price volatility, Bollinger Bands can be your answer. This beginner-friendly guide will walk you through everything you need to know about Bollinger Bands from understanding the basics to applying proven trading strategies that work in Indian markets.
Whether you're trading Nifty, Bank Nifty, or individual stocks like Reliance, HDFC Bank, or Tata Motors, Bollinger Bands can help you spot overbought and oversold conditions, predict breakouts, and manage risk effectively. By the end of this article, you'll have the knowledge to confidently use this powerful technical indicator in your trading journey.
What Are Bollinger Bands?
Bollinger Bands are a technical analysis tool developed by John Bollinger in the 1980s to help traders and investors measure market volatility and identify potential trading opportunities. Think of them as dynamic boundaries that move with the stock price, expanding when volatility increases and contracting when the market calms down.
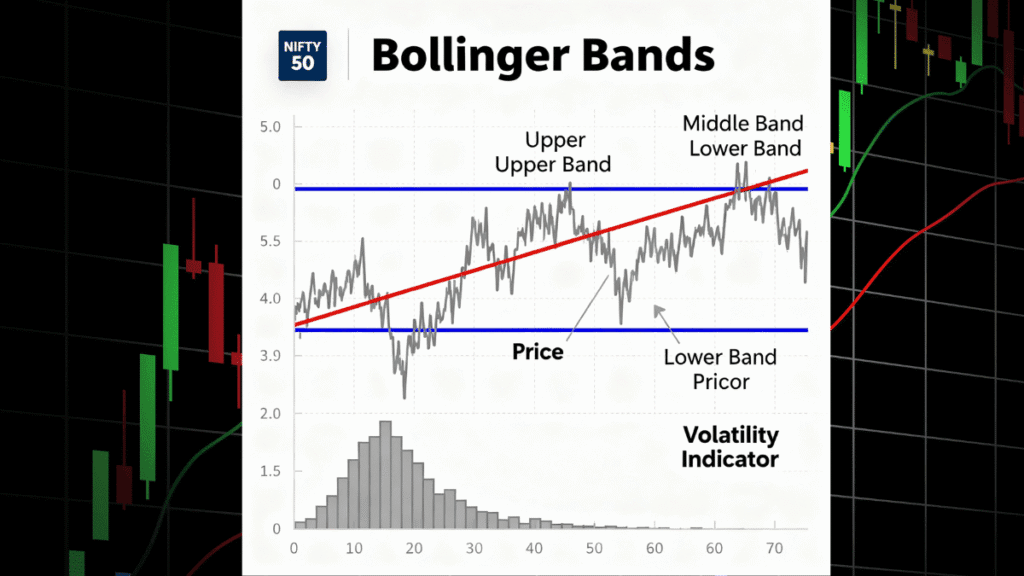
The indicator consists of three lines plotted on a price chart:
Middle Band: This is a 20-day Simple Moving Average (SMA) of the closing prices. It represents the average price over the past 20 trading sessions.
Upper Band: Calculated by adding two standard deviations to the middle band. This band moves upward when prices become more volatile.
Lower Band: Calculated by subtracting two standard deviations from the middle band. This band moves downward with increased volatility.
Standard deviation is a statistical measure that captures how much prices vary from the average. Using two standard deviations means approximately 95% of price movements typically stay within the bands. When prices touch or move beyond these bands, it signals something unusual is happening in the market.
Why Bollinger Bands Matter for Stock Traders
Bollinger Bands provide valuable insights that can significantly improve your trading decisions, especially in the Indian stock market. Here's why they matter:
Volatility Measurement: The width of the bands tells you whether the market is calm or volatile. Wide bands indicate high volatility, while narrow bands suggest low volatility. For instance, during major market events or earnings announcements, you'll often see the bands widen dramatically.
Overbought and Oversold Signals: When a stock price touches the upper band, it may indicate overbought conditions—meaning the stock could be overpriced and due for a correction. Conversely, when the price touches the lower band, it suggests oversold conditions and a potential buying opportunity.
Breakout Prediction: A significant contraction of the bands, known as a “squeeze,” often signals that a major price move is coming. This is particularly useful for capturing explosive moves in trending stocks.
Risk Management: Bollinger Bands help you set logical stop-loss orders and take-profit targets by providing dynamic support and resistance levels. This adaptability makes them superior to fixed price levels.
For Indian traders working with stocks like Infosys, SBI, or sectoral indices, Bollinger Bands can help navigate both trending and range-bound markets with greater confidence.
Real-Life Example: HDFC Bank
Let's look at a practical example from the Indian market. Suppose HDFC Bank is trading in a range between ₹1,200 and ₹1,300.
When the stock touches the lower band near ₹1,200, it indicates oversold conditions and suggests a potential bounce. A trader could enter a long position at this level with a stop-loss slightly below ₹1,190.
As the price moves upward, the trader can exit at the middle band around ₹1,250 for a conservative 4% gain, or hold until the upper band at ₹1,300 for an 8% return. This simple strategy demonstrates how Bollinger Bands provide clear, actionable entry and exit points.
How Bollinger Bands Are Calculated
Understanding the calculation helps you appreciate how Bollinger Bands work, even though most trading platforms like Zerodha, Upstox, or TradingView calculate them automatically.
Step 1: Calculate the Middle Band
Middle Band = 20-day Simple Moving Average (SMA)
Add up the closing prices of the last 20 trading days and divide by 20.
Step 2: Calculate the Standard Deviation
Standard Deviation = Square root of [(Sum of (Price – Average)²) / 20]
This measures how much the price varies from the average over 20 days.
Step 3: Calculate the Upper and Lower Bands
Upper Band = Middle Band + (2 × Standard Deviation)
Lower Band = Middle Band – (2 × Standard Deviation)
Example Calculation
If a stock has a 20-day SMA of ₹500 and a standard deviation of ₹25:
- Middle Band = ₹500
- Upper Band = ₹500 + (2 × ₹25) = ₹550
- Lower Band = ₹500 – (2 × ₹25) = ₹450
This means the price is expected to trade between ₹450 and ₹550 under normal conditions.
Strategies to Apply Bollinger Bands in Stock Trading
Bollinger Bands offer multiple trading strategies suitable for different market conditions and trading styles. Here are the most effective approaches for Indian markets.
Strategy 1: Bollinger Band Bounce
This mean-reversion strategy works best in range-bound markets where prices oscillate between support and resistance.
Buy Signal: When the price touches or moves below the lower band and shows signs of reversing back upward.
Sell Signal: When the price touches or exceeds the upper band, indicating potential overbought conditions.
How to Trade:
- Wait for the price to touch the lower band
- Look for a bullish candlestick pattern or RSI below 30 for confirmation
- Enter a long position with a stop-loss below the recent swing low
- Exit near the middle band or upper band depending on your risk appetite
This strategy works exceptionally well with stocks that trade in well-defined ranges, like many banking stocks during consolidation phases.
Strategy 2: Bollinger Band Squeeze Breakout
The squeeze strategy capitalizes on periods of low volatility that typically precede explosive price movements.
Identifying a Squeeze: Look for bands that have narrowed significantly compared to recent weeks. The bands should be tighter than they've been in the last six months.
Waiting for the Breakout: Don't trade during the squeeze itself. Wait for a strong candle that closes decisively beyond either the upper or lower band.
Confirming the Move: Check for increased trading volume on the breakout candle. Higher volume confirms strong market participation.
Entry Point: Enter when the price breaks and closes beyond the band with high volume.
Stop-Loss Placement: Place your stop-loss just below the opposite band or below the consolidation range.
For example, Wipro showed a squeeze between June and September 2020, followed by an upward breakout that offered significant profit opportunities.
Strategy 3: Riding the Bands in Trending Markets
In strong trending markets, prices often “walk the band”—meaning they repeatedly touch or hug the upper band in an uptrend or the lower band in a downtrend.
In an Uptrend: When the price consistently stays near the upper band and the middle band acts as support, it signals strong bullish momentum. Enter on pullbacks to the middle band rather than shorting at the upper band.
In a Downtrend: When the price hugs the lower band, it indicates persistent bearish pressure. Short positions near the middle band during pullbacks can be profitable.
This strategy contradicts the common beginner mistake of always expecting reversals at the bands. In trending markets, band touches signal continuation, not reversal.
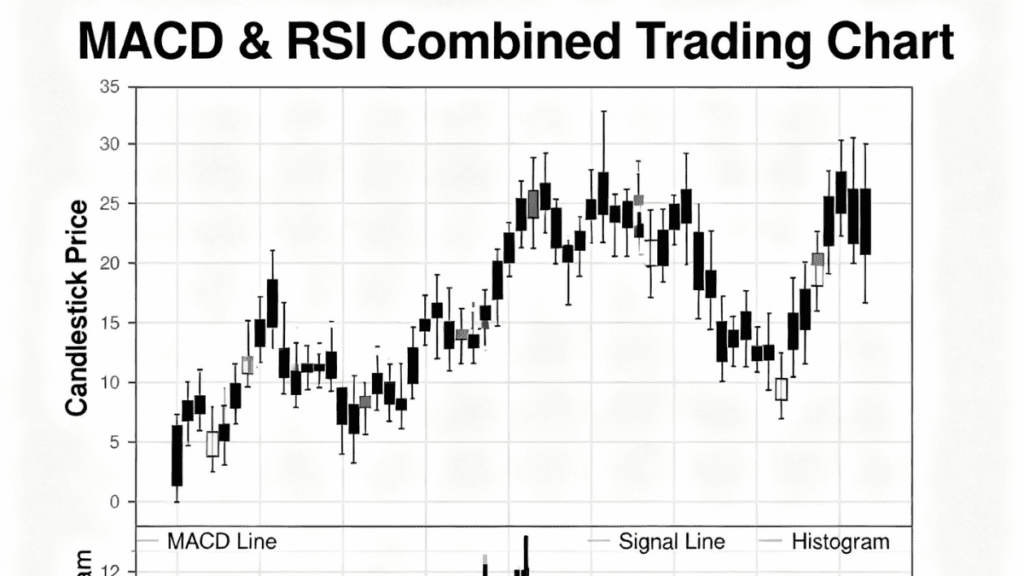
Strategy 4: Combining Bollinger Bands with RSI and MACD
Using multiple indicators together significantly reduces false signals and improves trade accuracy.
Buy Setup:
- Price touches or dips below the lower Bollinger Band (oversold condition)
- RSI is below 30 and starts turning upward (momentum confirmation)
- MACD line crosses above the signal line (trend confirmation)
Sell Setup:
- Price touches or exceeds the upper Bollinger Band (overbought condition)
- RSI is above 70 and turning downward
- MACD line crosses below the signal line
This multi-indicator approach works particularly well for intraday and swing trading in volatile Indian markets.
Pro Tips for Success
Match Settings to Your Timeframe: Day traders often use a 10-period SMA with 1.5 standard deviations for faster signals. Swing traders stick with the default 20-period and 2 standard deviations. Long-term traders may use 50-period with 2.5 standard deviations for smoother signals.
Always Confirm with Volume: Breakouts without volume confirmation often fail. Look for volume spikes that are at least 50% higher than the average.
Understand Market Context: Bollinger Bands behave differently in trending versus ranging markets. Use ADX (Average Directional Index) to determine market conditions—readings below 25 indicate range-bound markets where bounce strategies work best.
Don't Trade Every Touch: Just because the price touches a band doesn't guarantee a reversal. Wait for additional confirmation from candlestick patterns, support/resistance levels, or other indicators.
Common Mistakes to Avoid
Even experienced traders make these errors when using Bollinger Bands. Avoiding them will significantly improve your results.
Assuming Band Touches Always Mean Reversals: The biggest mistake beginners make is selling every time the price touches the upper band or buying at the lower band. In strong trending markets, prices can “ride” the bands for extended periods. For example, during Reliance's strong rally in 2020, the stock repeatedly touched the upper band without reversing.
Ignoring Volume Confirmation: Trading breakouts without checking volume often leads to false signals. A genuine breakout should be accompanied by volume that's significantly higher than recent averages. Low-volume moves typically fail and reverse quickly.
Using Bollinger Bands in Isolation: Relying solely on Bollinger Bands without confirmation from other indicators increases your risk of false signals. Always combine them with RSI, MACD, or volume analysis for better accuracy.
Trading During the Squeeze: Many traders make the mistake of entering positions when bands contract, before the breakout occurs. The squeeze only signals that a move is coming—it doesn't tell you the direction. Wait for the actual breakout before committing capital.
Using the Same Settings for All Markets: The default 20-period and 2 standard deviation settings don't work equally well for all stocks or timeframes. Highly volatile stocks may require wider settings (2.5 or 3 standard deviations) to avoid excessive false signals.
Overreacting to Fake Breakouts: The “head fake” is common—prices break out in one direction briefly, only to reverse and move strongly in the opposite direction. Using additional confirmation tools helps you avoid getting caught in these traps.
Expert Insights on Bollinger Bands
Understanding the deeper mechanics of Bollinger Bands will elevate your trading to a professional level.
Volatility Cycles: Markets alternate between periods of low and high volatility. A squeeze (band contraction) doesn't just predict a breakout—it represents accumulated market energy waiting to be released. The longer the squeeze lasts, the more powerful the eventual breakout tends to be.
Statistical Significance: The use of two standard deviations means that statistically, 95% of price action should occur within the bands. When prices move beyond the bands, it represents a two-standard-deviation event—something that should only happen about 5% of the time. This makes band breaches statistically significant.
Band Direction Matters: During strong trends, the bands themselves slope in the trend direction. In a powerful uptrend, the lower band actually turns upward. When the lower band starts turning back down after pointing up, it often signals the trend may be weakening.
Adaptation to Different Assets: While the 20-period and 2-standard-deviation settings work for most stocks, commodities and forex markets may require different parameters. Indian traders should backtest settings on their preferred stocks to find optimal configurations.
Performance in Different Market Conditions: Bollinger Bands excel in range-bound markets for bounce trading and during volatility transitions for breakout trading. However, they perform poorly in choppy, directionless markets where prices whipsaw without clear trends.
For Indian traders, combining Bollinger Bands with an understanding of market sentiment, news events, and fundamental factors creates a more complete trading approach. Remember that technical indicators work best when integrated with sound risk management and realistic profit expectations.
Risk Management with Bollinger Bands
Effective risk management separates successful traders from those who struggle. Bollinger Bands provide excellent tools for managing risk systematically.
Stop-Loss Placement: For long positions, place your stop-loss just below the lower band or below the recent swing low within the consolidation pattern. For short positions, place stops just above the upper band. This approach gives your trades enough breathing room while limiting potential losses.
Position Sizing During Squeezes: When bands are tight (squeeze conditions), consider starting with smaller position sizes. Only increase your position after the breakout is confirmed with strong volume and price action.
Trailing Stops: As your trade moves in your favor, use trailing stops to lock in profits. For example, in an uptrend, you might move your stop-loss to the middle band as the price approaches the upper band. This allows you to capture more of the move while protecting gains.
ATR-Based Stops: Combine Bollinger Bands with the Average True Range (ATR) indicator for more adaptive stop-loss levels. In normal volatility, place stops at 2× ATR below your entry. During high volatility periods, widen this to 2.5-3× ATR.
Risk-Reward Ratios: Always aim for at least a 1:2 risk-reward ratio. If you're risking ₹100 per share, your potential profit should be at least ₹200. Bollinger Bands make this easy—if you enter at the lower band with a stop below it, your target can be the middle band (conservative) or upper band (aggressive).
Related Topics You Can Explore
Deepen your technical analysis knowledge with these related concepts:
- Read also: Understanding Moving Averages for Stock Trading (https://moniwise.in/moving-averages-trading-guide)
- Read also: RSI Indicator Explained: Find Overbought and Oversold Stocks (https://moniwise.in/rsi-indicator-guide)
- Read also: MACD Trading Strategy for Indian Stock Market (https://moniwise.in/macd-trading-strategy)
- Read also: Support and Resistance Levels: Beginner's Guide (https://moniwise.in/support-resistance-guide)
- Read also: Candlestick Patterns Every Trader Should Know (https://moniwise.in/candlestick-patterns-guide)
How to Start Trading with Bollinger Bands
Ready to implement Bollinger Bands in your trading? Follow these systematic steps to get started:
Step 1: Choose Your Trading Platform
Open your trading account with brokers like Zerodha, Upstox, or ICICI Direct that offer advanced charting tools with built-in Bollinger Bands indicators.
Step 2: Add Bollinger Bands to Your Chart
In your charting platform, add the Bollinger Bands indicator. Start with the default settings: 20-period SMA with 2 standard deviations.
Step 3: Identify the Market Condition
Determine whether the market is trending or range-bound. Use ADX indicator—readings below 25 indicate range-bound conditions suitable for bounce strategies, while readings above 25 suggest trending markets.
Step 4: Wait for Clear Signals
Don't force trades. Wait patiently for the price to touch the bands, or for a squeeze setup to form. Quality over quantity wins in trading.
Step 5: Confirm with Volume and Other Indicators
Before entering, check that volume supports your trade direction. Add RSI or MACD for additional confirmation.
Step 6: Execute with Proper Risk Management
Enter your trade with a predefined stop-loss and profit target. Never risk more than 1-2% of your trading capital on a single trade.
Step 7: Track and Review Your Trades
Maintain a trading journal documenting your Bollinger Band trades. Note what worked and what didn't to continuously improve your strategy.
FAQs About Bollinger Bands
Q1. What is the best timeframe to use Bollinger Bands in Indian stock market?
A1. For intraday trading, use 5-minute or 15-minute charts with 10-15 period settings. For swing trading, daily charts with standard 20-period settings work best. Long-term investors can use weekly charts with 50-period moving averages. The timeframe should match your trading style and risk tolerance.
Q2. Can Bollinger Bands be used for options trading?
A2. Yes, Bollinger Bands are highly effective for options trading. When bands are wide (high volatility), consider selling strategies like credit spreads or iron condors. When bands squeeze, look for directional trades using call or put options before breakouts occur. Bollinger Bands help assess implied volatility conditions crucial for option pricing.
Q3. Do Bollinger Bands work in all market conditions?
A3. Bollinger Bands work best in trending markets and range-bound conditions but struggle in choppy, directionless markets. They excel during volatility transitions—from low to high volatility during squeezes. In strongly trending markets, use them for trend continuation signals rather than reversal signals.
Q4. How do I avoid false signals with Bollinger Bands?
A4. Always combine Bollinger Bands with volume analysis and at least one other indicator like RSI or MACD. Wait for strong candlestick confirmation before entering trades. Never trade based solely on price touching the bands—look for additional technical evidence supporting your directional bias.
Q5. What are the limitations of Bollinger Bands?
A5. Bollinger Bands are lagging indicators based on historical prices, so they don't predict future moves—they respond to them. They can generate false signals during low-volatility whipsaw markets. The bands also don't indicate direction during squeezes, requiring patience until breakout occurs. Always use proper risk management regardless of indicator signals.
Conclusion
Bollinger Bands are among the most versatile and powerful technical indicators available to stock traders in India. By understanding how they measure volatility, signal overbought and oversold conditions, and predict breakouts, you can significantly improve your trading accuracy and profitability.
Remember that successful trading with Bollinger Bands requires patience, discipline, and a systematic approach. Start with the default 20-period settings and practice on paper or with small positions before committing larger capital. Always combine Bollinger Bands with other indicators and volume analysis for confirmation, and never skip proper risk management.
Whether you're trading large-cap stocks like Reliance and HDFC Bank, mid-cap opportunities, or indices like Nifty and Bank Nifty, Bollinger Bands provide the framework to identify high-probability trading setups. As you gain experience, you'll develop an intuitive feel for how prices interact with the bands in different market conditions.
Start applying these strategies in your trading today, but remember—no indicator is foolproof. Focus on consistent execution, disciplined risk management, and continuous learning. The stock market rewards traders who combine technical knowledge with emotional discipline and realistic expectations. Use Bollinger Bands as one tool in your comprehensive trading toolkit, and you'll be well-positioned to navigate the Indian markets successfully.
FAQs About Bollinger Bands
Q1. What is the minimum amount to start trading with Bollinger Bands?
A1. You can start trading with as little as ₹5,000 to ₹10,000 in your brokerage account. However, for proper risk management where you risk only 1-2% per trade, having ₹50,000 or more allows better position sizing and diversification across multiple stocks.
Q2. Are Bollinger Bands suitable for complete beginners?
A2. Yes, Bollinger Bands are beginner-friendly once you understand the basic concepts. Start by observing how prices interact with the bands on your favorite stocks without trading. Practice identifying squeezes, band touches, and breakouts on historical charts before risking real money. Combine with simple indicators like RSI for better results.
Q3. Can I use Bollinger Bands for cryptocurrency trading?
A3. Absolutely. Bollinger Bands work well for cryptocurrency trading due to crypto's high volatility. However, due to 24/7 trading and extreme volatility, consider using wider settings like 2.5-3 standard deviations to avoid excessive false signals. Always confirm signals with volume and other indicators.
Q4. How long does it take to master Bollinger Bands trading?
A4. Most traders need 3-6 months of consistent practice and chart time to become proficient with Bollinger Bands. Success depends on your dedication to learning, maintaining a trading journal, and reviewing both winning and losing trades to understand what works in different market conditions.