In the fast-paced world of stock trading, making informed decisions can be the difference between profit and loss. While the Indian stock market offers tremendous opportunities for wealth creation, it also demands careful analysis and strategic planning. Two of the most powerful technical indicators that can help you spot high-probability trading opportunities are the MACD with RSI combination. This dual-indicator strategy helps traders confirm trends, identify reversals, and filter out false signals, making it especially valuable for beginners navigating the complexities of Nifty, Bank Nifty, or individual stocks like Reliance, Infosys, and HDFC Bank
In this comprehensive guide, you'll learn what MACD and RSI are, why combining them creates a powerful trading strategy, and how to apply this approach step-by-step with real-world examples tailored for Indian market conditions.
What Is MACD (Moving Average Convergence Divergence)?
The Moving Average Convergence Divergence, commonly known as MACD, is a trend-following momentum indicator that analyzes the relationship between two exponential moving averages (EMAs). Developed to identify changes in trend strength, direction, and duration, the MACD consists of three key components that work together to generate trading signals.
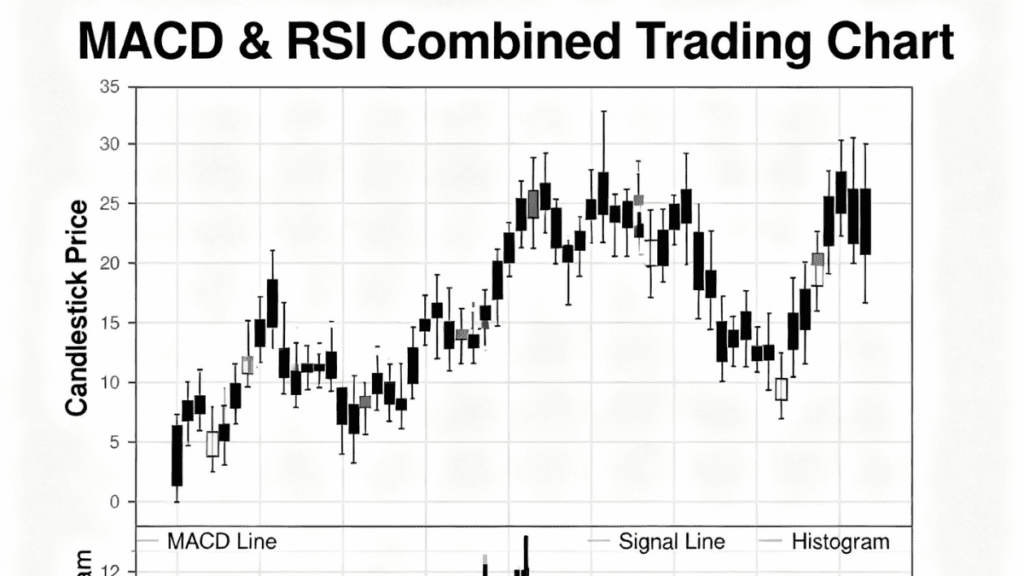
The MACD Line is calculated by subtracting the 26-period EMA from the 12-period EMA. This line represents the core momentum measurement. The Signal Line is a 9-period EMA of the MACD line itself, acting as a trigger for buy and sell signals. Finally, the Histogram displays the difference between the MACD line and the signal line, visually representing the strength of momentum.
When the MACD line crosses above the signal line, it generates a bullish signal suggesting upward momentum. Conversely, when the MACD line crosses below the signal line, it produces a bearish signal indicating potential downward movement. The standard MACD settings are 12, 26, and 9, though day traders sometimes adjust these to 3-10-16 or 5-34-1 for faster signals.
What Is RSI (Relative Strength Index)?
The Relative Strength Index, or RSI, is a momentum oscillator that measures the speed and magnitude of recent price changes to identify overbought or oversold conditions. This indicator oscillates between 0 and 100, providing traders with clear signals about potential market reversals.
RSI readings above 70 typically indicate overbought conditions, suggesting the asset may be due for a pullback or correction. Readings below 30 signal oversold conditions, indicating the asset might be undervalued and due for a bounce. An RSI level crossing above 50 suggests strengthening bullish momentum, while a drop below 50 indicates a shift toward bearish pressure.
The default RSI setting uses a 14-period timeframe, which strikes an effective balance between responsiveness and reliability for most trading strategies. However, day traders and scalpers often use shorter periods like 7 or 9 for more frequent signals, while swing traders may prefer longer periods such as 21 for smoother, more reliable readings.
Why Combining MACD with RSI Matters for Investors
Using MACD and RSI together creates a powerful analytical framework that addresses the limitations of each indicator when used alone. This combination approach significantly improves trading accuracy and reduces the risk of false signals that can lead to costly mistakes.
Complementary Analysis: MACD excels at identifying trend direction and strength, while RSI pinpoints overbought and oversold conditions. By analyzing price action from these two different perspectives, traders gain a more complete understanding of market dynamics. MACD tracks trend momentum through moving average relationships, while RSI measures the speed and magnitude of recent price changes.
Reduced False Signals: One of the biggest challenges in technical trading is distinguishing genuine signals from market noise. When both indicators align and confirm each other, the probability of a successful trade increases substantially. For instance, if MACD shows a bullish crossover while RSI simultaneously emerges from oversold territory, this dual confirmation provides much stronger conviction than either signal alone.
Enhanced Entry and Exit Timing: The MACD with RSI strategy uses a multi-timeframe approach that dramatically improves timing. Traders typically use MACD on higher timeframes like daily or 4-hour charts to establish the overall trend direction, then switch to lower timeframes with RSI to identify precise entry and exit points during pullbacks. This methodology ensures you're buying dips within confirmed uptrends or selling rallies within established downtrends.
Research shows that properly filtered MACD-RSI strategies achieve win rates between 55% and 73%, with the higher percentages occurring in trending markets. The profit factor—gross profit divided by gross loss—typically ranges from 1.5 to 2.3, indicating the strategy generates substantially more in profits than losses over time. Maximum drawdowns usually range from 15-25% of account equity, significantly lower than single-indicator approaches that often experience 30-40% drawdowns.
Real-Life Example: Spotting a Reversal in Reliance Industries
Consider a scenario where Reliance Industries has been in a downtrend for several weeks. On the daily chart, the stock makes a new low at ₹2,400, lower than its previous low at ₹2,450. However, when you examine the RSI, you notice it reached only 28 on this new low, higher than the previous RSI reading of 25. This bullish divergence suggests weakening selling pressure.
Shortly after, on your 4-hour chart, the MACD histogram begins shrinking in negative territory, and then the MACD line crosses above the signal line, confirming a momentum shift. As the RSI crosses back above 30 from oversold territory, you have a high-confidence bullish reversal signal backed by both indicators. This setup would have provided an excellent entry point before the stock reversed course and moved higher.
Strategies to Apply MACD with RSI for Trading Signals
Successfully implementing the MACD with RSI combination requires understanding specific entry and exit strategies that align both indicators for maximum effectiveness.
Strategy 1: Multi-Timeframe Trend Following
Begin by analyzing MACD on a higher timeframe to establish your directional bias. For swing traders, use the daily chart; for day traders, use the 4-hour chart. When the MACD line sits above the signal line with a positive histogram, this confirms a bullish trend. When the MACD line sits below the signal line with a negative histogram, this confirms a bearish trend.
Once you've identified the trend direction, switch to a lower timeframe—4-hour for swing traders or 1-hour for day traders—and use RSI to time your entries. For long positions in an uptrend, wait for RSI to dip into oversold territory below 30, then enter when RSI crosses back above 30, confirming the pullback has ended. For short positions in a downtrend, wait for RSI to rally into overbought territory above 70, then enter when RSI crosses back below 70, signaling the bounce has exhausted itself.
Strategy 2: Divergence Detection for Reversals
Divergences occur when price and indicators move in opposite directions, often signaling potential trend reversals before they fully develop. This advanced technique can help you capture major turning points in the market.
For bullish reversals, watch for price making lower lows while RSI makes higher lows—this bullish divergence indicates decreasing selling pressure. Wait for the MACD histogram to begin shrinking in negative territory, followed by the MACD line crossing above the signal line. Enter when RSI crosses back above 30 from oversold levels.
For bearish reversals, identify price making higher highs while RSI makes lower highs—this bearish divergence suggests weakening buying momentum. Look for the MACD histogram to begin decreasing in positive territory, followed by the MACD line crossing below the signal line. Enter when RSI crosses back below 70 from overbought territory.
Strategy 3: Confirmation Breakout Trading
This strategy combines both indicators to confirm breakouts from consolidation zones, reducing the risk of false breakouts that trap traders.
Wait for price to consolidate in a range, forming clear support and resistance levels. When price breaks above resistance, check that MACD shows a bullish crossover with the MACD line moving above the signal line. Simultaneously, verify that RSI is above 50 and rising, confirming momentum supports the breakout. Enter the trade only when both conditions align, placing your stop-loss just below the breakout level.
For bearish breakouts below support, ensure MACD shows a bearish crossover and RSI is below 50 and falling. This dual confirmation significantly increases the probability that the breakout is genuine rather than a false move.
Pro Tips for Implementation
Always align your trades with the broader market trend identified by MACD on higher timeframes. Trading against the major trend significantly reduces your success rate. Use tight risk management with stop-losses placed below recent swing lows for long positions or above recent swing highs for short positions. Consider using the Average True Range (ATR) indicator to set dynamic stop-loss levels that adapt to current market volatility.
Avoid trading during low-volume periods or when both indicators give conflicting signals. If RSI shows bullish conditions while MACD remains bearish, exercise patience and wait for alignment. The most profitable trades occur when both indicators confirm each other's signals simultaneously.
Mistakes to Avoid When Using MACD with RSI
Even experienced traders make common errors that can undermine the effectiveness of this powerful strategy.
Overrelying on Single Signals: One of the most frequent mistakes is acting on signals from just one indicator without waiting for confirmation from the other. For example, entering a trade simply because RSI crosses below 70 without checking whether MACD confirms the bearish momentum often results in premature entries during strong uptrends. Always wait for both indicators to align before taking action.
Ignoring the Broader Trend: Many traders misinterpret overbought and oversold readings as absolute buy and sell signals. In reality, assets can remain overbought for extended periods during strong uptrends or oversold during persistent downtrends. Always consider the overall market direction established by MACD on higher timeframes before acting on RSI extremes.
Using Default Settings for All Assets: Applying the same RSI and MACD parameters across all stocks and timeframes is a critical error. Different assets have varying volatility characteristics that require customized settings. Highly volatile stocks like small-cap companies might benefit from RSI settings of 80/20 instead of 70/30, while stable large-cap stocks work well with standard settings. Similarly, MACD settings should be adjusted based on whether you're day trading or swing trading.
Neglecting Divergence Signals: Traders often overlook divergences between price and indicators, missing valuable early warnings of trend reversals. When price makes new highs but RSI fails to confirm by making lower highs, this bearish divergence deserves serious attention. Ignoring such signals can keep you in losing positions long after momentum has shifted.
Trading in Sideways Markets: MACD performs poorly in range-bound, sideways markets where prices oscillate between support and resistance without establishing a clear trend. In these conditions, the MACD tends to drift toward the zero line and generates numerous false crossover signals. Recognize when markets are consolidating and avoid trading the MACD with RSI strategy until a clear directional trend emerges.
Inadequate Risk Management: Perhaps the most dangerous mistake is entering trades without proper stop-loss placement, regardless of how strong the indicators appear. No strategy, including MACD with RSI, is foolproof. Always define your maximum acceptable loss before entering any position and stick to your risk management rules consistently.
Expert Insights: Why Professional Traders Trust This Combination
Professional traders and technical analysts consistently rank the MACD with RSI combination among the most reliable technical setups for several research-backed reasons.
According to a comprehensive backtest study that included a third mean-reversion filter alongside MACD and RSI, the strategy demonstrated a 73% win rate over 235 trades, with an average gain of 0.88% per trade after accounting for commissions and slippage. This performance significantly outperformed strategies using single indicators alone.
The power of this combination lies in its ability to approach price analysis from complementary angles. As noted by technical analysis experts, “While MACD measures the relationship between two EMAs, RSI measures price change in relation to recent price highs and lows. These two indicators are often used together to provide analysts with a more complete technical picture of a market”.
Furthermore, the strategy's effectiveness varies by market condition, with trending markets producing the highest success rates. One trading research firm found that properly filtered MACD-RSI strategies achieve profit factors ranging from 1.5 to 2.3, meaning traders earn ₹1.50 to ₹2.30 for every rupee risked. This favorable risk-reward profile makes the strategy attractive for consistent long-term performance.
Industry practitioners emphasize that the real advantage comes from signal confirmation rather than prediction. As one professional trader notes, “MACD signals trend continuation, RSI shows there's enough momentum left for the move to continue, and entry is based on confirmation rather than prediction”. This conservative approach reduces emotional decision-making and keeps traders aligned with market reality.
According to SEBI-compliant trading education providers, combining indicators with disciplined risk control is essential rather than blindly following signals. The regulatory framework emphasizes that while technical indicators are valuable tools, they must be part of a comprehensive trading plan that includes proper position sizing, stop-loss management, and portfolio diversification.
Related Topics You Can Explore
- Read also: “Complete Guide to Bollinger Bands for Stock Trading” at https://moniwise.in/bollinger-bands-guide
- Read also: “Understanding Support and Resistance Levels in Indian Markets” at https://moniwise.in/support-resistance-levels
- Read also: “Moving Averages Explained: Simple vs Exponential” at https://moniwise.in/moving-averages-explained
- Read also: “Risk Management Strategies Every Trader Must Know” at https://moniwise.in/risk-management-strategies
Conclusion
The MACD with RSI combination represents one of the most effective technical analysis strategies available to traders in the Indian stock market. By using MACD to identify overall trend direction and RSI to optimize entry and exit timing, you develop a complete market perspective that significantly reduces false signals and improves trade quality.
The synergy between these indicators works because they analyze price action from fundamentally different perspectives—MACD tracking trend momentum through moving average relationships, and RSI measuring the speed and magnitude of recent price changes. This complementary analysis provides insights that neither indicator could deliver alone.
Remember to use multiple timeframes, with higher timeframes for trend direction and lower timeframes for precise timing. Always wait for confirmation from both indicators before entering trades, and apply strict risk management regardless of how compelling the signals appear. Recognize that different market conditions require different approaches—trending markets offer the best opportunities for this strategy, while sideways markets call for patience.
Start by practicing this strategy on paper or with small positions to build confidence and familiarity with how the indicators interact. With consistent application and ongoing refinement based on your trading style and risk tolerance, the MACD with RSI approach can become a cornerstone of your trading success, helping you navigate Nifty, Bank Nifty, and individual stocks with greater confidence and improved results.
Disclaimer: Trading in the stock market involves substantial risk and is not suitable for all investors. The strategies and examples provided in this article are for educational purposes only and should not be considered as financial advice. Past performance does not guarantee future results. Always conduct your own research, understand the risks involved, and consider consulting with a SEBI-registered investment advisor before making any investment decisions. The author and moniwise.in are not responsible for any losses incurred from trading based on the information provided in this article.
FAQs About Using MACD with RSI for Trading Signals
Q1. What are the best MACD and RSI settings for beginners in Indian markets?
A1. For beginners, stick with the standard MACD settings of 12-26-9 and RSI setting of 14 periods with overbought at 70 and oversold at 30. These default parameters work well across most Indian stocks and timeframes, providing a balanced approach between responsiveness and reliability.
Q2. Can MACD with RSI strategy work for intraday trading?
A2. Yes, the MACD with RSI combination is highly effective for intraday trading when properly adjusted. Day traders typically use MACD settings of 3-10-16 or 5-34-1 for faster signals, combined with RSI periods of 7 to 9 on 5-minute to 15-minute charts. However, be aware that shorter timeframes generate more signals, including false ones, requiring tighter risk management.
Q3. How do I know when both indicators are giving conflicting signals?
A3. Conflicting signals occur when one indicator suggests buying while the other suggests selling—for example, when MACD shows a bullish crossover but RSI remains above 70 in overbought territory. In such situations, the best approach is patience. Wait for both indicators to align before entering a trade, as the most reliable setups occur when both confirm the same direction simultaneously.
Q4. Is the MACD with RSI strategy suitable for long-term investing?
A4. While this strategy is primarily designed for active trading and swing trading, long-term investors can use it on weekly or monthly charts to identify major trend changes and optimal accumulation zones. However, for long-term wealth creation through stocks, fundamental analysis of company financials, competitive advantages, and growth prospects should take precedence over technical indicators.
How to Start with MACD and RSI Trading Strategy
- Open your charting platform and add both MACD (12-26-9 settings) and RSI (14-period setting) indicators to your daily chart of any Indian stock or index like Nifty 50.
- Identify the trend direction by observing whether the MACD line is above or below the signal line on the daily timeframe—this becomes your trading bias.
- Switch to a lower timeframe (4-hour or 1-hour chart) and wait for RSI to reach extreme levels—below 30 for long setups in uptrends, or above 70 for short setups in downtrends.
- Confirm the entry signal when RSI reverses from extreme levels and MACD shows a crossover in the same direction as your identified trend.
- Place your stop-loss below the recent swing low for long positions or above the recent swing high for short positions, ensuring you risk no more than 1-2% of your trading capital.
- Set profit targets at key support/resistance levels or use a risk-to-reward ratio of at least 1:2, meaning you aim to make ₹2 for every ₹1 you risk.
- Track your trades in a journal, recording entry reasons, exit points, and lessons learned to continuously refine your strategy based on real market experience.