Risk vs Reward: How Math Teaches Smart Investing
When you invest your hard-earned money in stocks, mutual funds, or any financial instrument, you're essentially making a bet on the future. But how do you know if that bet is worth taking? The answer lies in understanding the mathematical relationship between risk and reward. Mathematical concepts aren't just for textbooks—they're powerful tools that help everyday investors make informed, rational decisions rather than relying on emotions or guesswork. In this guide, we'll explore how simple math can transform you from a hopeful investor into a strategic one.
What Is the Risk-Reward Concept in Investing?
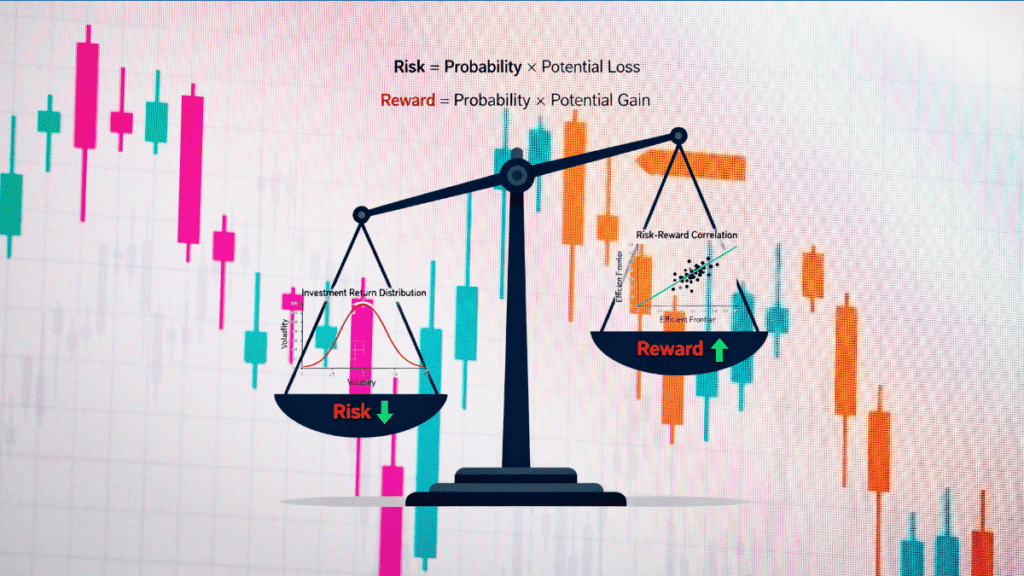
The risk-reward relationship is the fundamental principle that higher potential returns usually come with higher potential losses. Think of it as a balancing scale where one side holds the profit you might gain, and the other holds the money you might lose.
In mathematical terms, risk represents the amount you could lose if an investment doesn't perform as expected, while reward is the potential profit you expect to earn. The risk-reward ratio is calculated by dividing your potential loss by your potential gain.
For example, if you're considering buying a stock at ₹100 with an expected target of ₹130 and a stop-loss at ₹90, your potential reward is ₹30 and your potential risk is ₹10. This gives you a risk-reward ratio of 1:3—meaning for every rupee you risk, you expect to earn three.
Most financial advisors recommend maintaining a risk-reward ratio between 1:2 and 1:3 for worthy investments. This ensures that even if some of your investments don't work out, the winning trades can compensate for the losses.
Why Mathematical Thinking Matters for Investors
Removes Emotional Decision-Making
Markets are volatile, and emotions like fear and greed often lead investors to make poor choices. Mathematics provides an objective framework that helps you evaluate opportunities based on facts rather than feelings.
Quantifies Uncertainty
Investing is never about certainties—it's about probabilities. By using mathematical tools, you can calculate the likelihood of different outcomes and make decisions that favor positive long-term results.
Enables Better Portfolio Management
Understanding concepts like diversification, correlation, and standard deviation helps you build a balanced portfolio that maximizes returns while controlling risk.
Aligns with SEBI Guidelines
The Securities and Exchange Board of India (SEBI) emphasizes transparency and informed decision-making in investments. Mathematical analysis supports these principles by providing measurable criteria for investment choices.
Real-Life Example: The Power of Numbers
Imagine two investors, Rahul and Priya, each with ₹1,00,000 to invest.
Rahul doesn't calculate anything. He invests based on tips from friends and market rumors. Sometimes he wins big, but more often he loses. Over time, his portfolio becomes unpredictable and stressful.
Priya uses mathematical analysis. Before every investment, she calculates the expected value, assesses the risk-reward ratio, and diversifies her portfolio based on correlation. While she doesn't win every time, her consistent approach leads to steady growth with manageable losses.
After five years, Priya's portfolio shows stable 12-15% annual returns, while Rahul's portfolio swings wildly between gains and losses, averaging only 5-7% returns.
Key Mathematical Concepts Every Investor Should Know
Expected Value: Predicting Average Returns
Expected value (EV) is a formula that helps you estimate the likely average return from an investment by considering all possible outcomes and their probabilities.
Formula:
EV=∑(Probability of Outcome×Value of Outcome)EV=∑(Probability of Outcome×Value of Outcome)
Example:
Suppose you're evaluating a stock investment with two scenarios:
- 60% probability of gaining ₹10,000
- 40% probability of losing ₹5,000
EV=(0.6×10,000)+(0.4×−5,000)=6,000−2,000=₹4,000EV=(0.6×10,000)+(0.4×−5,000)=6,000−2,000=₹4,000
A positive expected value of ₹4,000 suggests this investment is mathematically favorable.
Compound Interest: The Eighth Wonder
Albert Einstein reportedly called compound interest “the eighth wonder of the world.” This powerful concept shows how your returns can generate their own returns over time.
Formula:
A=P(1+r100)tA=P(1+100r)t
Where:
- A = Future value
- P = Principal amount
- r = Annual interest rate
- t = Time period in years
Example:
If you invest ₹1,00,000 at 12% annual return for 10 years:
A=1,00,000(1+12100)10=₹3,10,584A=1,00,000(1+10012)10=₹3,10,584
Your investment more than triples, with ₹2,10,584 coming from compound growth.
The key lesson: start early and stay invested. Time is the most powerful ingredient in the compounding formula.
Standard Deviation: Measuring Volatility
Standard deviation measures how much an investment's returns fluctuate from the average. Higher standard deviation means higher volatility and, typically, higher risk.
If a mutual fund has an average annual return of 12% with a standard deviation of 8%, approximately 68% of the time, its returns will fall between 4% and 20%.
Why it matters:
Risk-averse investors should prefer investments with lower standard deviation, while those comfortable with volatility might accept higher standard deviation for potentially higher returns.
Beta Coefficient: Systematic Risk Indicator
Beta measures how much a stock or portfolio moves compared to the overall market.
- Beta = 1.0: Moves in line with the market
- Beta > 1.0: More volatile than the market (higher risk, potentially higher reward)
- Beta < 1.0: Less volatile than the market (lower risk, steadier returns)
- Negative Beta: Moves opposite to the market (rare, seen in gold or inverse ETFs)
Example:
If Stock A has a beta of 1.5 and the Nifty 50 rises by 10%, Stock A is expected to rise by approximately 15%. Conversely, if the market falls 10%, Stock A might fall 15%.
Understanding beta helps you align your investment choices with your risk tolerance.
Diversification Mathematics: Reducing Portfolio Risk
The mathematical principle behind diversification states that a portfolio's overall risk is not simply the average of individual asset risks—it also depends on how those assets move relative to each other, measured by correlation.
Formula for two-asset portfolio standard deviation:
σp=wA2σA2+wB2σB2+2wAwBσAσBρABσp=wA2σA2+wB2σB2+2wAwBσAσBρAB
Where correlation coefficient (ρρ) ranges from -1 to +1:
- +1: Assets move perfectly together (no diversification benefit)
- 0: No relationship (some diversification benefit)
- -1: Assets move in opposite directions (maximum diversification benefit)
Practical application:
By holding stocks from different sectors with low correlation, you can reduce overall portfolio volatility without sacrificing expected returns.
Rupee Cost Averaging: SIP's Mathematical Advantage
Rupee Cost Averaging (RCA) is the benefit you gain when investing a fixed amount regularly through Systematic Investment Plans (SIPs). The math is simple yet powerful: when markets fall, your fixed investment buys more units; when markets rise, it buys fewer units.
Example:
| Month | NAV (₹) | Investment (₹) | Units Purchased |
|---|---|---|---|
| Jan | 50 | 5,000 | 100.00 |
| Feb | 45 | 5,000 | 111.11 |
| Mar | 40 | 5,000 | 125.00 |
| Apr | 55 | 5,000 | 90.91 |
| Total | Average: ₹47.50 | ₹20,000 | 427.02 |
Average cost per unit = ₹20,000 ÷ 427.02 = ₹46.84
Compare this to investing ₹20,000 as a lump sum in January at ₹50/unit, which would give you only 400 units. RCA helped you accumulate 27 extra units at a lower average cost.
This mathematical advantage makes SIPs particularly effective during volatile markets.
Strategies to Apply Mathematical Concepts in Your Investment Journey
Calculate Risk-Reward Before Every Trade
Never enter an investment without knowing your potential loss and gain. Set a clear target price and stop-loss level, then calculate if the ratio justifies the investment.
Use Expected Value for Scenario Analysis
When evaluating mutual funds or stocks, consider multiple scenarios (bullish, neutral, bearish) with estimated probabilities. Calculate the expected value to see if the investment is mathematically sound.
Harness Compound Interest Through Early Investing
The compounding formula clearly shows that time (tt) has exponential impact. Starting 10 years earlier can make more difference than doubling your investment amount later.
Monitor Standard Deviation in Mutual Funds
When comparing similar funds, check their standard deviation alongside returns. A fund with 14% returns and 6% standard deviation is often better than one with 15% returns but 12% standard deviation.
Diversify Based on Correlation, Not Just Asset Count
Owning 10 stocks from the same sector doesn't provide true diversification. Build a portfolio across asset classes and sectors with low correlation to mathematically reduce risk.
Start SIPs for Automatic Rupee Cost Averaging
Instead of timing the market, let mathematics work for you. Regular SIP investments automatically apply rupee cost averaging, removing emotional decisions from the equation.
Pro Tips for Beginner Investors
Avoid These Common Mistakes:
- Ignoring the risk side: Many beginners focus only on potential rewards without calculating potential losses
- Stopping SIPs during market falls: This is when rupee cost averaging provides maximum benefit by acquiring more units cheaply
- Overlooking expense ratios: A fund charging 2.5% versus 1.5% can significantly impact long-term compounded returns
- Confusing volatility with risk: High standard deviation isn't always bad—it depends on your investment horizon and goals
- Over-diversification: Holding too many similar assets reduces the mathematical benefit of diversification
Smart Practices:
- Review your risk-reward ratios quarterly and rebalance if needed
- Use SIP calculators to visualize the power of compounding before committing
- Learn to read fund fact sheets showing beta, standard deviation, and Sharpe ratio
- Maintain an investment journal documenting your mathematical analysis and outcomes
- Stay updated with SEBI guidelines and investor protection regulations
Expert Insights: What the Numbers Tell Us
Historical data from global markets shows that over 98% of the time, equities beat cash returns over 20-year investment horizons. This probability-based insight reinforces the importance of long-term equity exposure for wealth creation.
Research on portfolio diversification demonstrates that the maximum risk reduction benefits occur within the first 15-20 stocks, after which additional diversification provides diminishing returns. This mathematical principle helps investors avoid unnecessary complexity.
Studies on systematic investing reveal that investors who maintain SIP discipline through market cycles achieve 2-3% higher annualized returns compared to those who try to time the market. The mathematics of rupee cost averaging explains this outperformance.
SEBI's recent regulatory reforms focus on reducing Total Expense Ratios (TER) by 0.10-0.15%, which can translate to lakhs of rupees in additional returns over a 20-30 year investment journey due to compounding effects.
Related Topics You Can Explore
- Read also: Mutual Funds for Beginners with Small Amount – Start with ₹100
- Read also: SIP Calculator India 2025 – Calculate Mutual Fund Returns Online
- Read also: Beginner’s Guide to Stock Trading: Tips, Steps & Common Mistakes
FAQs About Risk vs Reward in Investing
Q1. What is a good risk-reward ratio for stock investments?
A1. Most investment professionals recommend maintaining a risk-reward ratio between 1:2 and 1:3, meaning you should aim to gain at least two to three rupees for every rupee you risk. However, this can vary based on your investment strategy and risk tolerance.
Q2. How do I calculate expected value for my investments?
A2. Multiply each possible outcome by its probability, then sum all the results. If the expected value is positive, it indicates a mathematically favorable investment opportunity. For example: (60% × ₹10,000 gain) + (40% × ₹5,000 loss) = ₹4,000 expected value.
Q3. Is higher standard deviation always bad for investments?
A3. Not necessarily. Higher standard deviation indicates greater volatility, which means higher risk but also potentially higher returns. Young investors with long time horizons can often tolerate higher standard deviation better than those nearing retirement.
Q4. How does rupee cost averaging benefit SIP investors?
A4. By investing a fixed amount regularly, you automatically buy more units when prices are low and fewer when prices are high, reducing your average cost per unit over time. This mathematical advantage works best in volatile markets.
Q5. What is beta and why should I care about it?
A5. Beta measures how much a stock or fund moves compared to the overall market. A beta above 1 means higher volatility (and risk), while below 1 means more stability. Understanding beta helps you match investments to your risk appetite.
Q6. Can mathematical analysis guarantee investment success?
A6. No. Mathematics helps you make more informed, probability-based decisions, but markets are influenced by countless unpredictable factors. Think of math as a tool that improves your odds, not as a crystal ball that predicts the future.
Conclusion
Understanding the mathematical relationship between risk and reward transforms investing from gambling into strategic wealth-building. Concepts like risk-reward ratio, expected value, compound interest, standard deviation, beta, diversification mathematics, and rupee cost averaging aren't abstract theories—they're practical tools that help you make smarter decisions with your money.
The beauty of mathematical investing is that it doesn't require complex calculations or advanced degrees. Simple formulas applied consistently can significantly improve your investment outcomes over time. By quantifying risk, calculating probabilities, and leveraging the power of compounding, you create a disciplined framework that removes emotion from your investment process.
Remember, every successful investor—from Warren Buffett to Indian market veterans—relies on mathematical principles to guide their decisions. The numbers don't lie, and they don't panic during market volatility. Start small, use the concepts we've discussed, maintain discipline through SIPs, and let mathematics work its magic on your wealth-creation journey.
Your financial future isn't about luck—it's about making mathematically sound decisions today that compound into prosperity tomorrow. Stay informed, stay invested, and always let the numbers guide your path.
Disclaimer: This article is for educational purposes only and does not constitute financial advice. Investment in securities markets is subject to market risks. Please read all scheme-related documents carefully before investing. Past performance is not indicative of future returns. Consult a SEBI-registered investment advisor before making investment decisions.