Bullish Momentum Scanner: Are You Missing These 4 Signals Before a Trade?
A Bullish Momentum Scanner can help traders narrow a large stock universe to stocks currently satisfying predefined bullish technical conditions.
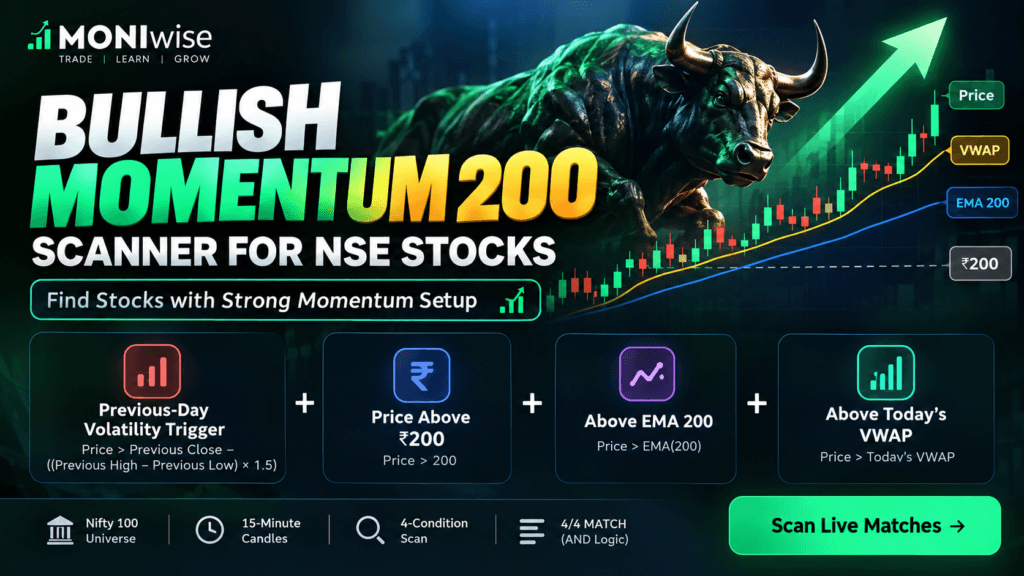
The MONIwise Bullish Momentum 200 scanner checks Nifty 100 stocks using four conditions based on price, previous-day volatility, EMA 200 and the current trading day’s VWAP.
Instead of manually opening every chart, the scanner evaluates each stock and shows whether it currently passes 4/4, 3/4, 2/4, 1/4 or 0/4 conditions.
A stock becomes a full MATCH only when all four conditions pass at the same time.
What Is the Bullish Momentum 200 Scanner?
Bullish Momentum 200 is a rule-based technical scanner designed to identify stocks whose latest 15-minute closing price satisfies four conditions:
1. Price > Previous-Day Volatility Trigger
2. Price > ₹200
3. Price > EMA 200
4. Price > Today’s VWAP
The scanner uses AND logic.
That means satisfying three conditions is not enough for a full match.
A stock must pass:
Condition 1 AND Condition 2 AND Condition 3 AND Condition 4
to receive a MATCH result.
Check Current Bullish Momentum Matches
Instead of manually checking the Nifty 100 stocks one by one, you can run the live scanner and see which stocks currently satisfy all four conditions.
Find Current Bullish Momentum Matches
Scan Nifty 100 stocks for 4/4 matches using EMA200, VWAP, the ₹200 filter and our previous-day volatility trigger.
Open Bullish Momentum Scanner →Nifty 100 • 15-Minute Data • 4-Condition Scan
How Does the Bullish Momentum Scanner Work?
The scanner evaluates the latest available 15-minute closing price against four separate filters.
Let’s examine each one.
Condition 1: Previous-Day Volatility Trigger
The first condition uses the previous trading day’s High, Low and Close.
The scanner calculates:
Previous Range = Previous High − Previous Low
It then calculates the trigger:
Trigger Level = Previous Close − ((Previous High − Previous Low) × 1.5)
The latest 15-minute closing price must be:
Price > Trigger Level
Example
Suppose the previous trading day had:
Previous High = ₹1,000
Previous Low = ₹960
Previous Close = ₹985
Previous range:
₹1,000 − ₹960 = ₹40
Multiply this by 1.5:
₹40 × 1.5 = ₹60
The volatility trigger becomes:
₹985 − ₹60 = ₹925
The current 15-minute close therefore needs to remain above ₹925 to pass this condition.
This filter should not be interpreted by itself as a prediction that the stock will rise. It is simply one component of the four-condition scanner.
Condition 2: Price Above ₹200
The second condition is straightforward:
Price > ₹200
If the latest 15-minute closing price is ₹200 or lower, the stock fails this condition.
The ₹200 requirement acts as a price filter within this particular scanner.
It does not mean stocks above ₹200 are inherently better investments than lower-priced stocks.
Condition 3: Price Above EMA 200
The third condition requires:
Price > EMA(200)
EMA stands for Exponential Moving Average.
The MONIwise scanner calculates a 200-period EMA using 15-minute closing prices.
Compared with a simple moving average, an exponential moving average gives greater weighting to more recent observations.
For this scanner, the important question is straightforward:
Is the latest 15-minute close above EMA200?
If yes, this condition passes.
If no, it fails.
Why Include EMA200?
EMA200 provides longer-term price context relative to the 15-minute data used by this scanner.
However, being above EMA200 does not guarantee continued upward movement.
The scanner uses it as one filter alongside VWAP, the ₹200 requirement and the previous-day volatility trigger.
Condition 4: Price Above Today’s VWAP
The fourth condition requires:
Price > Today’s VWAP
VWAP stands for Volume Weighted Average Price.
The scanner calculates VWAP from the current trading day’s 15-minute candles and resets it for each trading session.
For each candle, it uses typical price:
Typical Price = (High + Low + Close) ÷ 3
That value is combined with volume to calculate the session VWAP.
The latest 15-minute closing price must remain above the resulting VWAP to pass this condition.
Why Combine EMA200 and VWAP?
EMA200 and VWAP provide different information.
EMA200 compares the current price with a longer moving-average reference calculated from 15-minute closes.
VWAP reflects the current trading session and incorporates volume.
A stock can therefore be above one while remaining below the other.
Bullish Momentum 200 requires price to be above both.
This makes the scanner more selective than simply searching for stocks above VWAP or EMA200 individually.
What Does a 4/4 Score Mean?
The scanner contains a Score column showing how many conditions currently pass.
4/4
All four conditions pass.
The scanner displays:
MATCH
3/4
Three conditions pass and one fails.
The stock is not a full match.
The table shows which individual condition is preventing the stock from qualifying.
2/4
Two conditions currently pass.
1/4
Only one condition passes.
0/4
None of the four configured conditions currently pass.
The score makes it easier to understand why a stock did or did not qualify rather than displaying only a simple yes/no result.
What Does MATCH Actually Mean?
This distinction is important.
A MATCH means:
- Price is above the calculated previous-day volatility trigger.
- Price is above ₹200.
- Price is above the 200-period EMA.
- Price is above today’s VWAP.
It does not mean:
- the stock is guaranteed to rise,
- a breakout is confirmed,
- the stock is fundamentally strong,
- a particular target will be reached,
- or the stock should automatically be bought.
The result describes the scanner’s current technical conditions.
How to Read the Bullish Momentum Scanner
The live results table displays:
- Symbol
- Price
- Trigger
- EMA200
- VWAP
- Previous High
- Previous Low
- Previous Close
- Score
- Result
Under several values, the scanner also displays individual pass/fail indicators.
For example:
✓ ABOVE ₹200
✓ ABOVE TRIGGER
✓ ABOVE EMA200
✓ ABOVE VWAP
This makes it possible to see why a stock received its current score.
Understanding the Current Scan Statistics
At the top of the scanner you’ll see summary statistics including:
Stocks Scanned – number of stocks evaluated.
Full Matches – stocks passing all four conditions.
Trigger Pass – stocks currently above the volatility trigger.
₹200 Pass – stocks whose latest closing price is above ₹200.
EMA200 Pass – stocks currently above EMA200.
VWAP Pass – stocks currently above the session VWAP.
These numbers can change as new market data becomes available.
They are descriptive statistics for the scanner—not market forecasts.
Why Use a Bullish Momentum Scanner?
A scanner primarily helps with filtering.
If you want to examine a large group such as the Nifty 100, manually checking several technical conditions on every chart takes time.
A scanner can perform the first filtering stage automatically.
Instead of asking:
“Which stocks should I buy?”
a more appropriate question for this tool is:
“Which stocks currently satisfy all four technical conditions I want to investigate?”
You can then perform additional analysis on the resulting shortlist.
How Traders Can Use the Scanner
One possible workflow is:
Step 1: Run the Bullish Momentum Scanner.
Step 2: Look at the current 4/4 matches.
Step 3: Open the charts of stocks you want to investigate further.
Step 4: Examine price structure and nearby support/resistance.
Step 5: Check whether price is extended or approaching an important level.
Step 6: Consider volume and broader market conditions.
Step 7: Define risk according to your own trading plan before taking any position.
The scanner is therefore a stock-discovery tool, not a substitute for complete analysis.
Bullish Momentum Scanner vs VWAP Scanner
A simple VWAP scanner might only ask:
Is Price > VWAP?
Bullish Momentum 200 is more restrictive.
It requires:
Price > VWAP
AND
Price > EMA200
AND
Price > ₹200
AND
Price > Previous-Day Volatility Trigger
A stock above VWAP can therefore still receive NO MATCH if one of the other conditions fails.
If your primary interest is VWAP itself, you can also use the MONIwise VWAP Scanner to focus specifically on VWAP-related setups.
Bullish Momentum and Support & Resistance
Passing all four scanner conditions does not tell you where the nearest resistance is located.
For example, a stock may be:
- above EMA200,
- above VWAP,
- above ₹200,
- above the volatility trigger,
while simultaneously trading directly underneath an important resistance level.
That’s why scanner results can be combined with chart analysis rather than interpreted in isolation.
For more background, read our Support and Resistance Levels guide.
Is Price Above EMA200 Always Bullish?
Being above EMA200 is commonly used as technical context, but the scanner does not assume that this guarantees future bullish performance.
Price can move back below EMA200.
False breakouts can occur.
Broader market conditions can change.
EMA200 is therefore one condition in the scanner—not a prediction engine.
Is Price Above VWAP Always Bullish?
No.
Price above VWAP tells you where the latest closing price sits relative to the session’s volume-weighted average.
It does not guarantee that price will remain above VWAP.
This is one reason Bullish Momentum 200 combines VWAP with additional filters instead of relying on VWAP alone.
Can a 4/4 Match Turn Into NO MATCH?
Yes.
Scanner conditions are dynamic.
Suppose a stock currently passes all four conditions.
If a later 15-minute close falls below VWAP, its score could change from:
4/4 → 3/4
and it would no longer be a full match.
Likewise, changes relative to EMA200 or another required condition can change the result.
The scanner therefore represents conditions based on the latest data available to it.
Bullish Momentum Scanner vs Stock Recommendations
MONIwise does not treat a scanner match as a stock recommendation.
The scanner answers a defined technical question:
Which stocks currently satisfy these four programmed conditions?
It does not answer:
Which stock will make money?
Those are fundamentally different questions.
A technical scanner can reduce the amount of manual screening required, but uncertainty and market risk remain.
Check Current Nifty 100 Momentum Matches
The MONIwise Bullish Momentum 200 scanner automatically checks its configured stock universe and displays each condition alongside the final score.
Stocks passing all four conditions receive:
4/4 – MATCH
Stocks missing one or more conditions remain:
NO MATCH
Which Stocks Currently Score 4/4?
View the latest scanner results, individual condition status, EMA200, VWAP, volatility trigger and momentum score.
Check Current 4/4 Matches →Frequently Asked Questions
What is a Bullish Momentum Scanner?
A Bullish Momentum Scanner filters stocks according to predefined technical conditions associated with bullish price positioning. MONIwise Bullish Momentum 200 uses four specific conditions involving a previous-day volatility trigger, ₹200 price filter, EMA200 and session VWAP.
Which stocks does the MONIwise Bullish Momentum Scanner check?
The current Bullish Momentum 200 implementation is used with the Nifty 100 universe supplied by the MONIwise scanner.
What timeframe does Bullish Momentum 200 use?
The scanner calculations use 15-minute candles.
What conditions are required for a MATCH?
All four must pass:
Price > Previous Close − ((Previous High − Previous Low) × 1.5)
Price > ₹200
Price > EMA200
Price > Today’s VWAP
What does 4/4 mean?
A 4/4 score means all four configured scanner conditions currently pass. The stock receives a MATCH result.
What does 3/4 mean?
A 3/4 score means three conditions pass but one currently fails. Because the scanner uses AND logic, 3/4 is not a full match.
How is EMA200 calculated in the scanner?
The scanner calculates a 200-period exponential moving average from 15-minute closing-price data.
Does VWAP reset every day?
Yes. The scanner’s VWAP calculation uses the current trading day’s candles and resets for each trading session.
Is a MATCH a buy signal?
No. A MATCH means all four programmed technical conditions currently pass. It should not by itself be interpreted as a recommendation to buy a stock.
Can scanner results change during the day?
Yes. As new 15-minute market data becomes available, conditions such as price relative to VWAP or EMA200 can change.
Final Thoughts
The MONIwise Bullish Momentum Scanner is designed to make technical stock filtering faster.
Instead of checking multiple indicators manually across the Nifty 100, Bullish Momentum 200 evaluates four conditions:
Price > Volatility Trigger
Price > ₹200
Price > EMA200
Price > VWAP
Only stocks satisfying all four simultaneously receive a 4/4 MATCH.
The individual condition indicators and score also make it possible to understand why other stocks failed to qualify.
The scanner’s purpose is straightforward: find stocks satisfying a defined technical setup so that you can decide which charts deserve further research.
It does not predict future returns or replace independent analysis and risk management.
Disclaimer: MONIwise scanners and educational content are provided for informational and educational purposes only. Scanner results represent programmed technical conditions and are not investment, trading, buy, sell or hold recommendations. Technical indicators cannot guarantee future market performance. Conduct your own research and consider your financial circumstances and risk tolerance before making financial decisions.