VWAP Scanner: How to Find Stocks Above VWAP in the Indian Market
Finding stocks with strong intraday momentum can be difficult when you have to open and analyse dozens of charts individually. A VWAP scanner simplifies this process by screening multiple stocks and identifying those that meet predefined VWAP and momentum conditions.
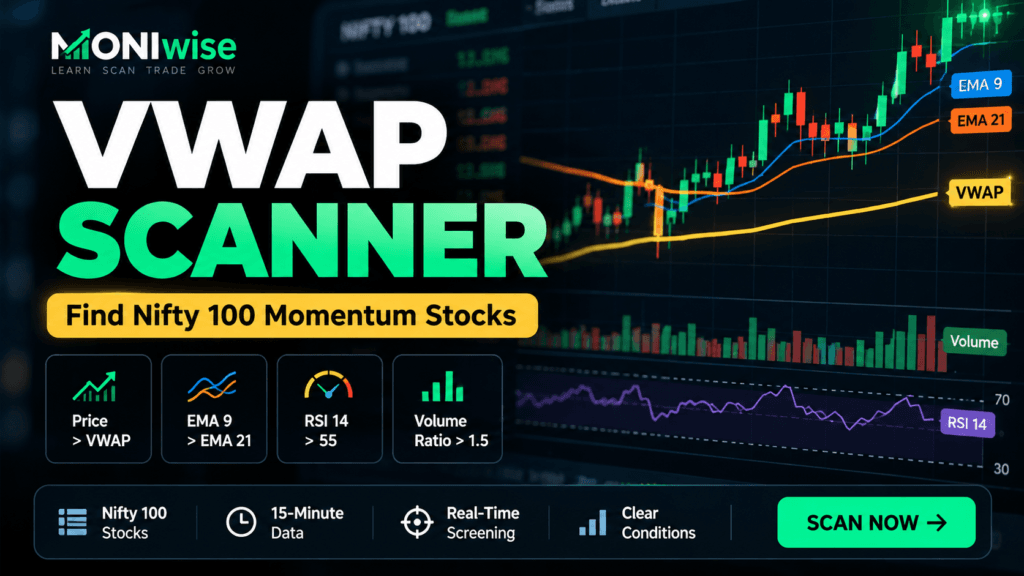
The MONIwise VWAP Momentum Scanner is designed to scan the Nifty 100 universe using 15-minute market data. Instead of relying only on whether a stock is trading above VWAP, the scanner combines VWAP with short-term EMA alignment, RSI momentum and volume activity.
This guide explains what VWAP is, how a VWAP scanner works, what the MONIwise scanner looks for, and how traders can interpret the results.
What Is VWAP?
VWAP stands for Volume Weighted Average Price.
Unlike a simple average price, VWAP takes both price and trading volume into account. This makes it useful for understanding where a stock has traded on a volume-weighted basis during the relevant calculation period.
Traders commonly compare the current market price with VWAP to understand the stock’s position relative to this benchmark.
In simple terms:
- Price above VWAP indicates that the current price is above the calculated volume-weighted average.
- Price below VWAP indicates that the current price is below that level.
However, price being above VWAP alone does not automatically mean that a stock is a good trade. This is why the MONIwise scanner combines VWAP with additional momentum and volume conditions.
For additional background on VWAP and its calculation, see Investopedia’s guide to Volume Weighted Average Price (VWAP).
What Is a VWAP Scanner?
A VWAP scanner automatically checks a group of stocks and filters them according to predefined VWAP-related conditions.
Instead of manually opening chart after chart and checking whether each stock is above VWAP, a scanner can perform the screening process across an entire stock universe.
The MONIwise VWAP Momentum Scanner currently focuses on Nifty 100 stocks and uses 15-minute market data.
Use the live scanner to check the current Nifty 100 universe:
Ready to Scan the Nifty 100?
Check which Nifty 100 stocks currently satisfy our VWAP Momentum conditions.
Open Free VWAP Scanner →The scanner displays individual indicator values and whether each condition currently passes or fails.
How the MONIwise VWAP Scanner Works
MONIwise does not classify a stock as a match merely because its price is above VWAP.
A stock must satisfy all four configured conditions simultaneously:
1. Price > VWAP
The latest price must be above the calculated VWAP.
This is the scanner’s price-position condition.
Required condition:
Current Price > VWAP
If the current price is below VWAP, the stock cannot become a full match even when the other conditions pass.
2. EMA 9 > EMA 21
The scanner compares two exponential moving averages:
- 9-period EMA
- 21-period EMA
For the condition to pass:
EMA(9) > EMA(21)
The faster EMA being above the slower EMA is used by this scanner as its short-term trend-alignment condition.
VWAP tells us where the price sits relative to its volume-weighted benchmark, while the EMA condition adds another layer of short-term price-trend information.
3. RSI(14) > 55
The scanner also calculates the 14-period Relative Strength Index.
For this condition to pass:
RSI(14) > 55
The threshold is specifically greater than 55.
RSI is therefore being used as an additional momentum filter rather than relying only on price and moving-average positioning.
4. Volume Ratio > 1.5
Momentum without meaningful trading activity can produce very different market behaviour, so the scanner also includes a volume condition.
The configured requirement is:
Volume Ratio > 1.5
The scanner compares the current candle’s volume with the comparison average used by the system.
A volume ratio above 1.5 means the current volume is more than 1.5 times that comparison average.
When Does a Stock Become a MATCH?
The VWAP Momentum strategy uses AND logic.
That means:
Price > VWAP
AND
EMA(9) > EMA(21)
AND
RSI(14) > 55
AND
Volume Ratio > 1.5
= MATCH
All four conditions must be true at the same time.
If even one condition fails, the stock is classified as NO MATCH.
This distinction is important because the scanner is not simply displaying every stock above VWAP. It is looking for stocks where several configured technical conditions are aligned simultaneously.
How to Read the VWAP Scanner Results
The scanner displays the Nifty 100 stocks along with several useful columns:
- Current Price
- VWAP
- EMA 9
- EMA 21
- RSI 14
- Volume Ratio
- Result
Individual indicators beneath the values show whether specific conditions are currently satisfied.
For example, you may see:
✓ ABOVE VWAP
✓ EMA ALIGNMENT
✓ ABOVE 55
✓ VOLUME CONFIRMED
When all four are present, the stock receives a MATCH result.
If one or more conditions fail, the result remains NO MATCH.
This also makes the scanner useful for analysing stocks that are close to satisfying the complete setup rather than looking only at the final list of matches.
Why Combine VWAP With EMA, RSI and Volume?
Each indicator examines a different aspect of the current market setup.
VWAP provides the price-versus-volume-weighted-average condition.
EMA 9 and EMA 21 provide short-term trend alignment.
RSI(14) adds a momentum threshold.
Volume Ratio checks whether current trading activity exceeds the scanner’s configured comparison level.
Using several conditions does not guarantee a successful trade. Instead, the purpose is to narrow a large stock universe into a smaller group satisfying a predefined technical setup.
That can make the research process considerably more efficient than manually checking every Nifty 100 chart.
Stocks Above VWAP vs VWAP Momentum Matches
There is an important difference between these two concepts.
A stock can be above VWAP without becoming a VWAP Momentum MATCH.
For example:
Price > VWAP ✓
EMA 9 > EMA 21 ✓
RSI > 55 ✓
Volume Ratio > 1.5 ✕
The stock is above VWAP and satisfies three conditions, but it is still NO MATCH because the volume requirement has not passed.
This is one reason the MONIwise scanner displays the individual conditions instead of showing only a final yes/no result.
How Traders Can Use a VWAP Scanner
A scanner is best thought of as a screening and research tool.
For example, instead of manually analysing all Nifty 100 stocks, a trader can first use the scanner to identify the stocks currently satisfying the configured conditions.
The trader can then perform additional analysis on that smaller list.
Depending on the trader’s own strategy, that additional analysis might include chart structure, support and resistance, broader market direction, risk-to-reward considerations and trade invalidation levels.
A scanner helps answer:
“Which stocks currently satisfy my screening conditions?”
It does not by itself answer:
“Should I buy this stock?”
VWAP Scanner and Support & Resistance
VWAP should not necessarily be analysed in isolation.
Suppose a stock satisfies all four momentum conditions but is trading immediately below a significant resistance area. That context may matter to someone performing further technical analysis.
Similarly, support and resistance can help provide additional context around the levels visible on a chart.
If you’re new to these concepts, read our guide:
Support and Resistance Levels: A Practical Guide for Traders
Combining screening tools with broader chart analysis can provide more context than treating any single indicator as a complete trading system.
Is VWAP the Same as a Moving Average?
No.
Although both appear as price-reference lines on charts, they are calculated differently.
A conventional moving average is primarily based on historical prices over a specified number of periods.
VWAP incorporates both price and volume into its calculation.
The MONIwise scanner therefore uses both types of information rather than treating them as interchangeable:
- VWAP for the price-position condition
- EMA 9 and EMA 21 for short-term trend alignment
Why Use a Nifty 100 VWAP Scanner?
The Indian equity market contains thousands of listed securities. Screening every available stock can introduce liquidity differences, unusual price behaviour and an overwhelming number of results.
MONIwise currently concentrates this scanner on the Nifty 100 universe.
This gives users a defined stock universe to scan rather than an unrestricted list of securities.
As the platform develops, additional scanners and screening approaches can be added without changing the basic purpose: reducing manual chart-by-chart screening.
Can a VWAP Scanner Give False Signals?
Yes.
Technical conditions can align and the price can subsequently reverse.
Price can move back below VWAP. EMA relationships can change. RSI can weaken. Volume can decline. Broader market conditions can also change rapidly.
A scanner identifies when its programmed conditions are satisfied; it does not know what the market will do next.
This distinction is essential when using any technical stock scanner.
VWAP Scanner vs Stock Tips
MONIwise is designed as a screening tool rather than a stock-tip service.
A MATCH means that the stock currently satisfies the scanner’s configured technical conditions.
It should not automatically be interpreted as:
- a buy recommendation,
- a guaranteed breakout,
- a price target,
- or a prediction that the stock will rise.
Users should independently evaluate scanner results according to their own trading process and risk management.
Try the Free Nifty 100 VWAP Scanner
Instead of checking each Nifty 100 stock manually, you can view the current scanner results directly on MONIwise.
Open MONIwise VWAP Momentum Scanner
The scanner shows the calculated values for Price, VWAP, EMA 9, EMA 21, RSI 14 and
Volume Ratio, along with the pass/fail status of the strategy conditions.
Ready to Scan the Nifty 100?
Check which Nifty 100 stocks currently satisfy our VWAP Momentum conditions.
Open Free VWAP Scanner →Frequently Asked Questions
What is a VWAP scanner?
A VWAP scanner screens multiple stocks according to conditions involving the Volume Weighted Average Price. It can reduce the need to manually inspect every chart individually.
Does the MONIwise scanner show every stock above VWAP?
The scanner displays the Nifty 100 universe and the individual condition status, but a stock becomes a full VWAP Momentum MATCH only when all four configured conditions pass simultaneously.
What conditions does the MONIwise VWAP Momentum Scanner use?
The current strategy requires Price > VWAP, EMA(9) > EMA(21), RSI(14) > 55 and Volume Ratio > 1.5.
What timeframe does the scanner use?
The current VWAP Momentum implementation uses 15-minute candle data.
Is a stock above VWAP automatically bullish?
Not necessarily. Being above VWAP only describes the stock’s current price position relative to the calculated VWAP. It does not guarantee that the price will continue rising.
Is a MATCH a buy signal?
No. A MATCH indicates that all four configured scanner conditions are currently satisfied. It should not by itself be treated as a complete trade recommendation.
Is the MONIwise VWAP Scanner free?
The scanner is currently available through MONIwise for users to screen the Nifty 100 universe.
Final Thoughts
A VWAP scanner can make technical screening considerably faster by automatically checking a predefined stock universe.
The MONIwise VWAP Momentum Scanner goes beyond a simple “price above VWAP” filter by requiring four simultaneous conditions:
Price > VWAP + EMA(9) > EMA(21) + RSI(14) > 55 + Volume Ratio > 1.5.
This helps narrow the Nifty 100 universe to stocks currently satisfying the complete configured momentum setup.
The scanner should be used as a starting point for research rather than as a substitute for independent analysis and risk management.
Check the Current VWAP Scanner Results
Disclaimer: The information and scanner results provided by MONIwise are for educational and informational purposes only and should not be considered investment or trading advice. Technical indicators and scanner conditions do not guarantee future market performance. Always conduct your own research and consider your individual financial situation and risk tolerance before making trading or investment decisions.